Plots
You are reading the documentation of an outdated version, whose text may no longer be accurate. Go to the latest version.
dataframe/dfplot draws a frame with go-plot:
one line per column against the index, as df.plot() does, and Bar,
Barh, Hist, Area, Scatter and the Series variants. The legend names
the columns and the x label is the name of the index; a missing value breaks
a line. Each function returns a *plot.Figure, which saves as SVG or PNG and
shows in a notebook through Display.
Every figure on this page was drawn by go-dataframe v0.1.0 and go-plot v0.1.0 from the code shown under it; the CI draws it again and fails if one byte of the SVG differs.
Lines, and a rolling mean
package main

import (
	"math"

	"github.com/go-dataframe/dataframe"
	"github.com/go-dataframe/dataframe/dfplot"
	"github.com/go-plot/plot"
)

func init() { register("lines", lines) }

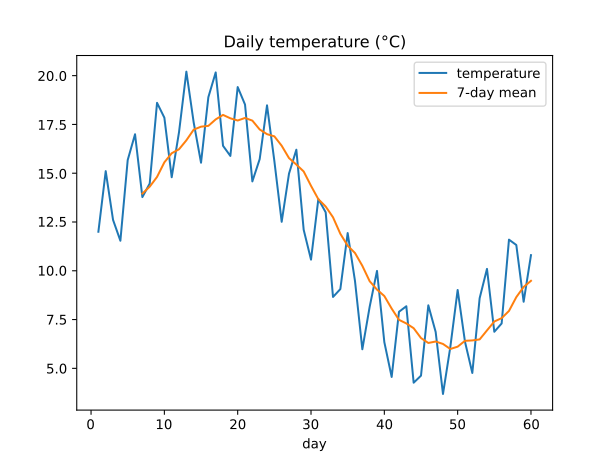
// Sixty days of a made-up daily temperature, and its 7-day rolling mean:
// s.rolling(7).mean(), then df.plot(). The first six means are missing,
// as in pandas, and the line starts at day 7.
func lines() *plot.Figure {
	day := make([]int, 60)
	temp := make([]float64, 60)
	for i := range day {
		day[i] = i + 1
		temp[i] = 12 + 6*math.Sin(2*math.Pi*float64(i)/60) + 2.5*math.Sin(1.7*float64(i))
	}
	s := dataframe.Must(dataframe.NewSeries("temperature", temp))
	r := dataframe.Must(s.Rolling(7))
	df := dataframe.Must(dataframe.New(
		dataframe.Col("day", day),
		dataframe.Col("temperature", s),
		dataframe.Col("7-day mean", r.Mean()),
	))
	df = dataframe.Must(df.SetIndex("day"))
	fig, err := dfplot.LineOpts(df, nil, []dfplot.Option{dfplot.WithTitle("Daily temperature (°C)")})
	if err != nil {
		panic(err)
	}
	return fig
}
Bars from a group-by
package main

import (
	"github.com/go-dataframe/dataframe"
	"github.com/go-dataframe/dataframe/dfplot"
	"github.com/go-plot/plot"
)

func init() { register("bars", bars) }

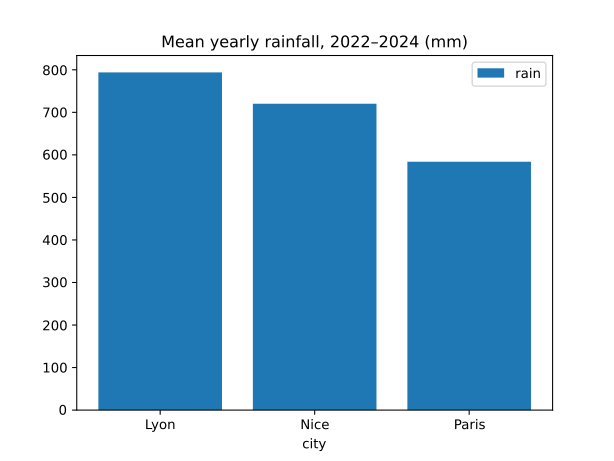
// df.groupby("city")[["rain"]].mean().plot.bar()
func bars() *plot.Figure {
	g := dataframe.Must(rainfall().GroupBy("city"))
	means := dataframe.Must(g.Mean())
	fig, err := dfplot.BarOpts(means, []string{"rain"}, []dfplot.Option{dfplot.WithTitle("Mean yearly rainfall, 2022–2024 (mm)")})
	if err != nil {
		panic(err)
	}
	return fig
}
The data, shared with the notebook display page:
package main

import "github.com/go-dataframe/dataframe"

// rainfall is the table the examples share: yearly rainfall in millimetres and
// rainy days at three stations. The numbers are made up for the example.
func rainfall() *dataframe.DataFrame {
	return dataframe.Must(dataframe.New(
		dataframe.Col("city", []string{"Lyon", "Paris", "Nice", "Lyon", "Paris", "Nice", "Lyon", "Paris", "Nice"}),
		dataframe.Col("year", []int{2022, 2022, 2022, 2023, 2023, 2023, 2024, 2024, 2024}),
		dataframe.Col("rain", []float64{741.2, 512.9, 698.4, 830.5, 640.2, 702.3, 810.0, 598.7, 760.1}),
		dataframe.Col("days", []int{98, 103, 61, 112, 118, 64, 107, 111, 70}),
	))
}
Created on by tannevaled
Modified on by tannevaled