go-dataframe is the table library of the Go scientific stack built on go-ndarray: Series, DataFrame and Index, with selection, missing data, group-by, joins, reshaping and time series, a fast CSV reader, Arrow and Parquet, notebook display and plots. Numeric columns are go-ndarray arrays, handed out without copying. No Python, no cgo.
func main() {
	// Yearly rainfall (mm) and rainy days at three stations; made-up numbers.
	df := dataframe.Must(dataframe.New(
		dataframe.Col("city", []string{"Lyon", "Paris", "Nice", "Lyon", "Paris", "Nice"}),
		dataframe.Col("year", []int{2023, 2023, 2023, 2024, 2024, 2024}),
		dataframe.Col("rain", []float64{830.5, 640.2, 702.3, 810.0, 598.7, 760.1}),
		dataframe.Col("days", []int{112, 118, 64, 107, 111, 70}),
	))

	// df.groupby("city")[["rain", "days"]].mean(), the wettest first.
	g := dataframe.Must(df.GroupBy("city"))
	g = dataframe.Must(g.Select("rain", "days"))
	means := dataframe.Must(g.Mean())
	means = dataframe.Must(means.SortValues([]string{"rain"}, false))
	fmt.Println(means)

	// What a notebook cell shows, and a bar chart.
	out := os.Args[1]
	write(filepath.Join(out, "out", "frame.txt"), means.Display()["text/plain"])
	write(filepath.Join(out, "out", "frame.html"), means.Display()["text/html"])
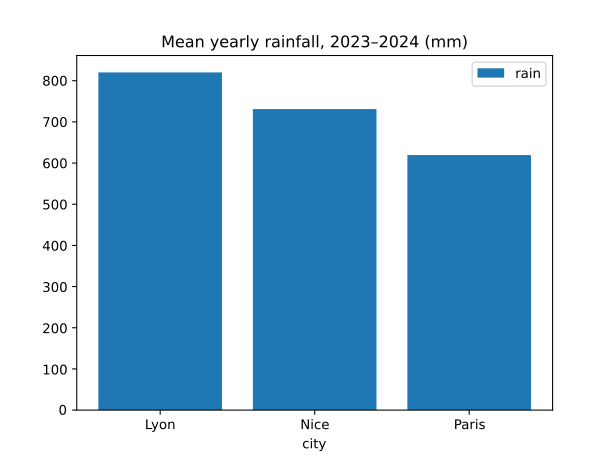
	fig := dataframe.Must(dfplot.BarOpts(means, []string{"rain"},
		[]dfplot.Option{dfplot.WithTitle("Mean yearly rainfall, 2023–2024 (mm)")}))
	f := dataframe.Must(os.Create(filepath.Join(out, "img", "figure.svg")))
	defer f.Close()
	if err := fig.SaveSVG(f); err != nil {
		panic(err)
	}
}
What it prints, laid out as pandas prints a frame; the table a notebook cell shows for the same frame, which is its Display text/html; and the frame drawn by dfplot with go-plot. All three are unedited, and the CI runs the program again and fails if one byte differs.
         rain   days
city
Lyon   820.25  109.5
Nice   731.20   67.0
Paris  619.45  114.5
| rain | days | |
|---|---|---|
| city | ||
| Lyon | 820.25 | 109.5 |
| Nice | 731.20 | 67.0 |
| Paris | 619.45 | 114.5 |
Reading a file, selecting, cleaning, grouping, joining, reshaping and plotting: each operation gives pandas' answer — values, dtypes, index and row order — under a Go name, and fallible calls return an error rather than raising.
Typed columns sharing one index of row labels; Loc, Iloc, boolean filters and Query. Every value is immutable: operations share the columns they did not change.
GroupBy with Agg, Merge and Concat, Pivot, PivotTable, Melt, Stack and Unstack.
ToDatetime, Resample, periods, the Dt accessor, Shift, Diff, CumSum and rolling windows.
Typed columns, column selection, row limits and dates parsed on request; about ten times pandas' C parser on ten million rows.
arrowio reads and writes Arrow IPC and Feather, parquetio Parquet, both over apache/arrow-go.
Numeric columns are go-ndarray arrays, handed out without copying: df.Values() is an *ndarray.Array.
Display gives a notebook the text and the HTML table; dfplot draws lines, bars, histograms, areas and scatter plots with go-plot.
Every repository of the organization.
The behavioural reference is pandas: its answers are recorded by scripts, committed, and replayed by the tests.
testdata/gen_fixtures.py records pandas 3.0’s answers — values, dtypes, index, NA handling, sort stability, group-by order, merge row order, repr text — and TestPandasFixtures replays them.
A corpus of 47 awkward CSV files, read with 69 option sets, compared with pandas’ parse of the same files.
Arrow and Parquet files written by pandas and pyarrow are read back and compared.
100% statement coverage of the whole module under -race, on Linux, macOS and Windows.
Tests run natively on amd64 and arm64 and under qemu on riscv64, loong64, ppc64le and s390x, which is big-endian.
What does not follow pandas does so on purpose, and is listed in the design document, not left to be discovered.
Medians of interleaved runs on 10⁷ rows, on a shared Apple M4 Max under load (load average 13–18), from the library's docs/perf.md. Milliseconds. The row in the library's colour is where pandas is faster. polars is faster than go-dataframe on every row but the CSV read with dates parsed.
| operation | go-dataframe | pandas 3.0 | polars |
|---|---|---|---|
read_csv (5 mixed columns) | 407 | 4220 (C) / 525 (pyarrow) | 360 |
read_csv, dates parsed | 362 | 5900 | 417 |
sort_values (stable, float key) | 446 | 973 | 298 |
merge (inner, int key) | 161 | 234 | 55 |
groupby("int key").sum() | 88 | 103 | 69 |
df[df.x > 0.5] | 74 | 75 | 20 |
groupby("str key").sum() | 222 | 204 | 60 |
Memory is at par with pandas for numeric columns and worse for strings: a Go []string costs 16 bytes a value, where pandas 3 and polars use Arrow-style buffers. The benchmark table takes 400 MB here, 349 MB in pandas, 269 MB in polars.
The library: Series, DataFrame and Index, selection, missing data, group-by, joins, reshaping, time series, a fast CSV reader and notebook display; arrowio (Arrow IPC, Feather), parquetio (Parquet) and dfplot (plots with go-plot).
The documentation (Hugo + Hextra): the API call by call, notebook display and plots produced by v0.1.0, and the library's design and performance documents. Source →
Logos and icons for the organization, in SVG / PNG / JPG / ICO / ICNS across colour, white and black variants.
go-dataframe keeps its numbers in go-ndarray arrays, draws them with go-plot, and a go-notebook cell shows a frame as a table. What differs from pandas on purpose, and what is not done yet, is in the documentation.
Read the source on GitHub → go-dataframe